

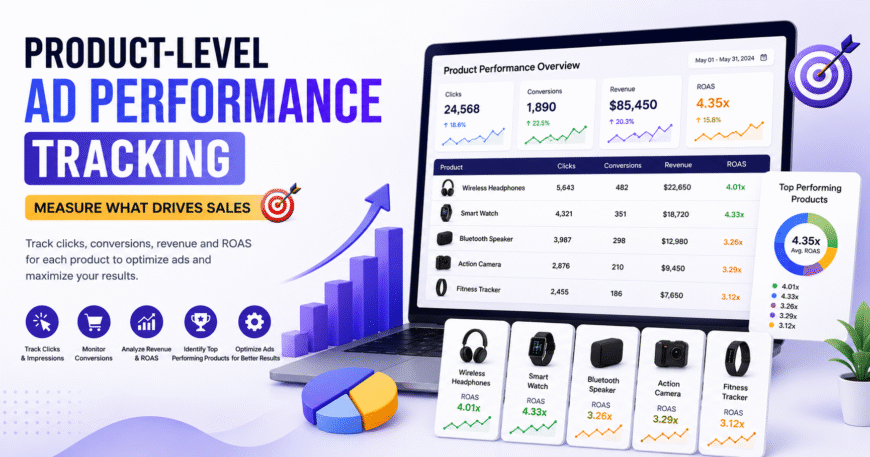
Promoting your products via paid advertisements without knowing what your products are doing can be quite challenging when it comes to managing your marketing budget. The reason is that your campaign will have thousands of impressions and clicks, but this doesn’t necessarily mean that all your promoted products are working well.
That’s where product-level ad performance tracking through paid ads can help.
Rather than focusing on the performance of your whole campaign, you can focus on the performance of your products separately to see which products generate clicks, conversions, sales, and profits.
Product level analysis of ads’ performance can be useful for ecommerce stores that promote their products through paid campaigns such as Google Ads, Meta Ads, shopping campaigns, etc.
What Is Product-Level Ad Performance Tracking?
Product level ad effectiveness means analyzing the performance of ads in terms of individual products or product groups instead of taking into consideration the performance of the whole campaign.
To understand this better, let us consider an ecommerce campaign featuring 50 products.
The total performance of the entire campaign will be:
- 100,000 impressions
- 5,000 clicks
- 200 purchases
- ₹5,00,000 revenue
The figures seem promising.
But what about the specific products responsible for the purchases?
On analyzing the individual products, it is seen that:
- Product A made 80 sales
- Product B made 50 sales
- Product C made 5 sales
- Product D received clicks but no sales
1. Track Product Impressions
The first thing is to analyze how often each product is mentioned in advertisements.
There may be a situation where a product is rarely mentioned in advertising due to the following reasons:
- Low search demand
- Small budget
- Poor product data
- Weak targeting
- High competition
The impression statistics help determine what products lack visibility.
Nevertheless, high impressions do not guarantee success of a product.
2. Measure Product Click-Through Rate
CTR stands for Click-Through Rate, which refers to how often users click on the advertised product.
A product that gets many impressions but clicks rarely might need improvement in the area of:
- Product title
- Picture
- Price
- Offer
- Relevance of Ad
- Targeting
For instance, when Product A has a 6% CTR and Product B has a 1% CTR in similar conditions, the former product might attract more people.
CTR should be evaluated with regard to conversions and profit instead of being seen as the ultimate criterion of success.
3. Track Product-Level Conversions
Clicks do not always lead to purchases.
Thus, conversion tracking becomes an essential element of product analysis.
For each product, measure:
- Adding to cart
- Checkout initiation
- Sales
- Leads
- Conversion rate
- Income
This will help to find out:
What products are converting the visitors from advertisements into buyers?
It is possible that a product which has fewer clicks but high conversion rate will be better than a product with thousands of clicks.
4. Measure Revenue and ROAS
Revenue and return on ad spend (ROAS) are important factors for companies that allocate sizable budgets to advertisements.
The formula for computing ROAS is as follows:
ROAS = Revenue Generated ÷ Advertising Budget
Consider the case of:
Product A
Advertising budget = ₹10,000
Revenue = ₹50,000
ROAS = 5x
Product B
Advertising budget = ₹10,000
Revenue = ₹15,000
ROAS = 1.5x
Here, both the products are allotted equal amount of advertising budgets, but product A produces significantly better results.
5. Identify High-Performing Products
The most obvious benefit of product level tracking is to discover those products which work well time and again.
These products could have:
- High conversion rate
- CTR
- ROAS
- Revenue
- Acquisition Cost
After these products are discovered, there could be further marketing efforts to increase the exposure or to run further campaigns around these products.
But this scaling should be done based on consistent performance rather than one or two good days.
6. Find Products That Need Optimization
Product level data can also be just as useful in identifying weak performers.
For instance, the product can have the following:
High impressions → High clicks → Few purchases
This might suggest that there is something wrong with the product post-click.
Some possible causes are:
- High product cost
- Poor landing page
- Bad product description
- Few reviews
- High shipping cost
- Bad mobile experience
- Check out problems
In such cases, spending more on advertising may not necessarily solve the problem.
7. Compare Products Across Advertising Channels
The same products are sometimes advertised by different companies on more than one platform.
For instance:
- Google ads
- Meta ads
- Product listing advertisements
- Affiliate marketing
- Retargeting campaigns
A product might be successful at Google due to the high intention to purchase, but this product may not be successful at social media.
It will be useful to make comparisons on product performance across platforms.
8. Use Product Data to Improve Budget Allocation
Not all advertising budget allocation has to be even among products.
If some products show higher results each time, companies can try to invest more money into them.
At the same time, products that underperform can be:
- Optimized
- Retargeted
- Received other creatives
- Tested with other audiences
- Reduced in spend
- Paused for a while
It will create a more data-driven approach to advertising.
9. Don’t Ignore Profitability
However, there is a difference between revenue and profits.
A product may make revenues of ₹1 lakh but have high costs of manufacturing, shipping, discounting, and advertising.
Thus, in cases where data on costs is available, profitability analysis of product-level advertising performance metrics becomes necessary.
The following metrics will be useful to use:
- Revenue
- Ad cost
- Product cost
- Cost per acquisition
- Gross margin
- Return On Ad Spend
- Contribution to profits
This provides a much clearer picture of the actual business value generated by advertising.
10. Create Regular Product Performance Reports
Product-level analysis becomes more useful when reviewed consistently.
A simple report can include:
| Product | Spend | Clicks | Conversions | Revenue | ROAS |
|---|---|---|---|---|---|
| Product A | ₹10,000 | 1,200 | 80 | ₹50,000 | 5x |
| Product B | ₹8,000 | 900 | 45 | ₹28,000 | 3.5x |
| Product C | ₹9,000 | 1,100 | 10 | ₹12,000 | 1.3x |
This makes it easier to identify winners and underperformers quickly.
Product-level ad performance tracking at the product level will assist firms in moving from campaign-level metrics to metrics that will help them know what is generating sales.
Through monitoring of impressions, clicks, conversions, revenue, ROAS, acquisition cost, and profits, decision-making regarding budget allocation, products, target audience, and media will become much easier for advertisers.
The idea here is not to just increase advertising spends. The objective is to know which products should get more spending, which products should be optimized, and which campaigns are making the difference.
With proper product-level data and good tracking and conversion measurement and optimization, advertising will become more measurable and growth-oriented.
